Longitudinal Study of Affordable Housing Units in Los Angeles County
Suggested Citation:
Rodman-Alvarez, Mattheis-Brown, de la Rosa (2021)Affordable Housing 2020: A Longitudinal Inventory Of Subsidized Low Income Housing In Los Angeles County. Los Angeles, CA. Pacific Urbanism. Retrieved from https://www.pacificurbanism.com/research-publications/2020/9/23/subsidized-low-income-housing-inventory-and-homelessness-count-s8lc6
Executive Summary
Housing resources in California are in crisis (Richman, 2000; Morrow, 2013; Baker et al., 2015; Monkkonen, 2020). As of 2019, whereas 37 million out of 128 million households nationwide, or 29%, were as cost burdened, meaning that they spend more than 30% of their income on housing, in Los Angeles, 70% of all households are cost burdened and over half of all renters are severely rent burdened, spending more than half of their household income on rent. (Woetzel, 2019; Baker et al., 2015) The problem has not gone unnoticed; in 1999, the National Low Income Housing Coalition published a report that outlined the housing affordability crisis in Los Angeles as well as the rest of the country. (Richman et al., 2000) In response to this report, the City of LA assembled a Task Force that attempted to tackle a problem that had reached a boiling point over twenty years ago. However, it is worth noting that some of the root causes of the affordable housing shortage predate the Los Angeles slow growth movement, which began in the 1960s. (Morrow, 2013) The legacy of racially motivated disparities in housing policies, including unequal access to homeownership opportunities, ethnic and economic segregation, and exclusionary zoning practices, such as downzoning, cannot be understated. (Franco, 2018) Today, housing production overall is eight times less than what it ought to be in order to bridge the housing shortage. Affordable housing production is less than a twentieth of the necessary supply rate to make up for over half a century of inequitable housing policies. While fiscal resources are being expended and depleted at unsustainable rates, the cost of housing continues to rise and the number of households falling into homelessness continues to increase. Now, different and perhaps better research methods and policies are necessary to formulate the problem definition adequately and to develop practicable, sustainable, and financially feasible solutions.
Introduction
The 2020 Greater Los Angeles Homeless Count by the Los Angeles Homeless Services Authority (LAHSA) identified nearly 64,000 homeless individuals, excluding Pasadena, Glendale, and Long Beach. Just over 41,000, or 65%, of those are located in the City of Los Angeles, which experienced a 16% increase from 2019. Public and private resources are being expended in an attempt to mitigate the situation, from $968 M committed or spent under the $1.2 B Proposition HHH bond to $460 M in the Mayor’s budget for Supportive Housing, Bridge Housing, services and facilities for homeless, $85 M in 2018 and $124 M in 2019 from the State of California, etc. However, until the rate of increase in cost of housing continues to outpace household income, more and more homes will continue to face precarious housing conditions and increasing numbers of households will fall into homelessness, as documented by the 2019 US Department of Housing and Urban Development report, “Market Predictors of Homelessness” (Nisar, 2019).
California is home to some of the most unaffordable cities in the country. The root causes in Los Angeles include exclusionary zoning, such as downzoning, lack of policy enforcement, rising construction and development costs, inequitable urban planning, a financial structure favoring nonresidential development, insufficient government spending, and crucially, suppressed housing supply rates. (Taylor, 2015; Morow, 2013; Taylor, 2015; Eikel, 1973; Knapp; 2007; Eikel, 1973; Richman, 2000) Housing cost inflation due to short supply continually increases, exacerbating income inequality and a series of urban ills that range from a loss of regional economic productivity and strains on the labor pool to time spent in traffic and greenhouse gas emissions (Baker et al., 2015)
A synthesis of best practices from a review of academic and policy literature identifies the following five categories to mitigate the housing crisis: Policy Reform, Supply Chain capacity development, Financing, Preservation, and a Paradigmatic Shift in the industry. (Richman, 2000; Lewis, 2003; Morrow, 2013; Taylor, 2015; Mischke, 2016; Brown, 2017; Kahlenberg, 2017; Ling, 2018; Woetzel, 2019; Brooks, 2019; Lee, 2017) Further, a scattered site approach has been identified as a more effective affordable housing strategy, as it allows households of various incomes to integrate into communities more successfully. (Nelson, 2014; Ecker, 2017; Graves, 2011) This report contributes to the body of academic and policy literature by taking a longitudinal approach to inventorize and track all subsidized low income housing units in LA County over time. The results may support neighborhood communities, industry leaders, and government agents in planning and policy formulation for more equitable housing resources in the LA region.
Housing Supply Rates
A report from the California Department of Housing and Community Development concluded that the State falls short of housing production by 100,000 homes per year. (Brown, 2017) The average annual rate of dwelling unit supply in the City of Los Angeles from 2013 through 2019 was only 7,000 units per year, eight times less than the 57,000 unit annual supply rate required of the coming eight year planning cycle under State law, that is, the 2029 RHNA Target. (Rodman-Alvarez et. al., 2020; Yoon, 2020) Further, over 90% of all housing built between 2014 and 2018 are affordable only to households making above the area median income. (Woetzel et al., 2019)
Affordable housing that is subsidized either partially or fully by public and private funds and agencies assists cost burdened households, including seniors, those living with mental health conditions, and so forth.
By 2029, over 259,000 net new units that are affordable to Median, Low, and Very Low Income households are required in the City of Los Angeles, an average of above 32,000 net new affordable units per year. (Yoon, 2020) By contrast, the average supply rate of affordable units in the City of Los Angeles from 2014 to 2018 was 1,500 units per year, a 22nd of the necessary supply rate. (Woetzel et al., 2019; Yoon, 2020). Also, while investigative journalism has recently reported on gross inefficiencies in City driven production of permanent supportive housing and emergency shelters for the unhoused, an accurate inventory of the existing low income subsidized housing stock is necessary in order to identify disparities in the number of affordable housing units per capita in each community.
Pipeline of Future Projects
As of January 2021, the Mayor’s office reports that there are 7,300 units and 111 projects in development in Los Angeles under Measure HHH. 5,742 are permanent supportive housing for homeless residents and 1,436 are affordable housing for non-homeless, very low income residents. (Garcetti, 2021) Additionally, the LA City Council approved $203M in bonds, not under Triple H, for six developments totaling 609 affordable units. (Sharp, 2020) According to LA City Planning, 4,790 affordable units have been approved in 2020. (Bertoni, 2021)
Methods
In 2015, the Southern California Association of Nonprofit Housing (SCANPH) began a database of all affordable housing units in Los Angeles, categorized by funding source. In 2018, Pacific Urbanism developed upon this dataset beginning a longitudinal study of all affordable units organized by City in LA County, Los Angeles City Council District, Community Plan Area, and Neighborhood Council Area. A main objective of this inventory is to identify areas bearing an unfair share of the housing burden as well as those areas of greater need by analyzing disparities in rates of units provided per capita and per area. This 2021 updated report is the most recent inventory published regarding affordable housing units in Los Angeles.
Various data sets were gathered and analyzed as part of this inventory. Beds and Permanent Supportive Housing units from the 2020 LAHSA Housing Count are reported separately in order to keep consistent units of measurement among the tables. Further, due to confidentiality issues regarding victims of domestic violence, transition aged youth, and others, the location of these beds are not reported. For example, St. Joseph’s Center is listed as containing a total of 1,389 beds in the categories of Permanent Supportive Housing, Rapid Re-Housing, and Emergency Shelter; 1,089 of those beds are listed in Venice. However, subsequent over-the-phone interviews conducted with key informants clarified that St. Joseph’s Center does not provide housing per se, but rather, acts as a conduit connecting clients with partners who then provide facilities and beds to clients. Also, note that where a CPA straddles the borders of more than one Council District, e.g., West LA in CD 11 and CD 5, the sum total of the CPAs with a centroid in a Council District will not match the total count for the Council District.
Results by Quadrant
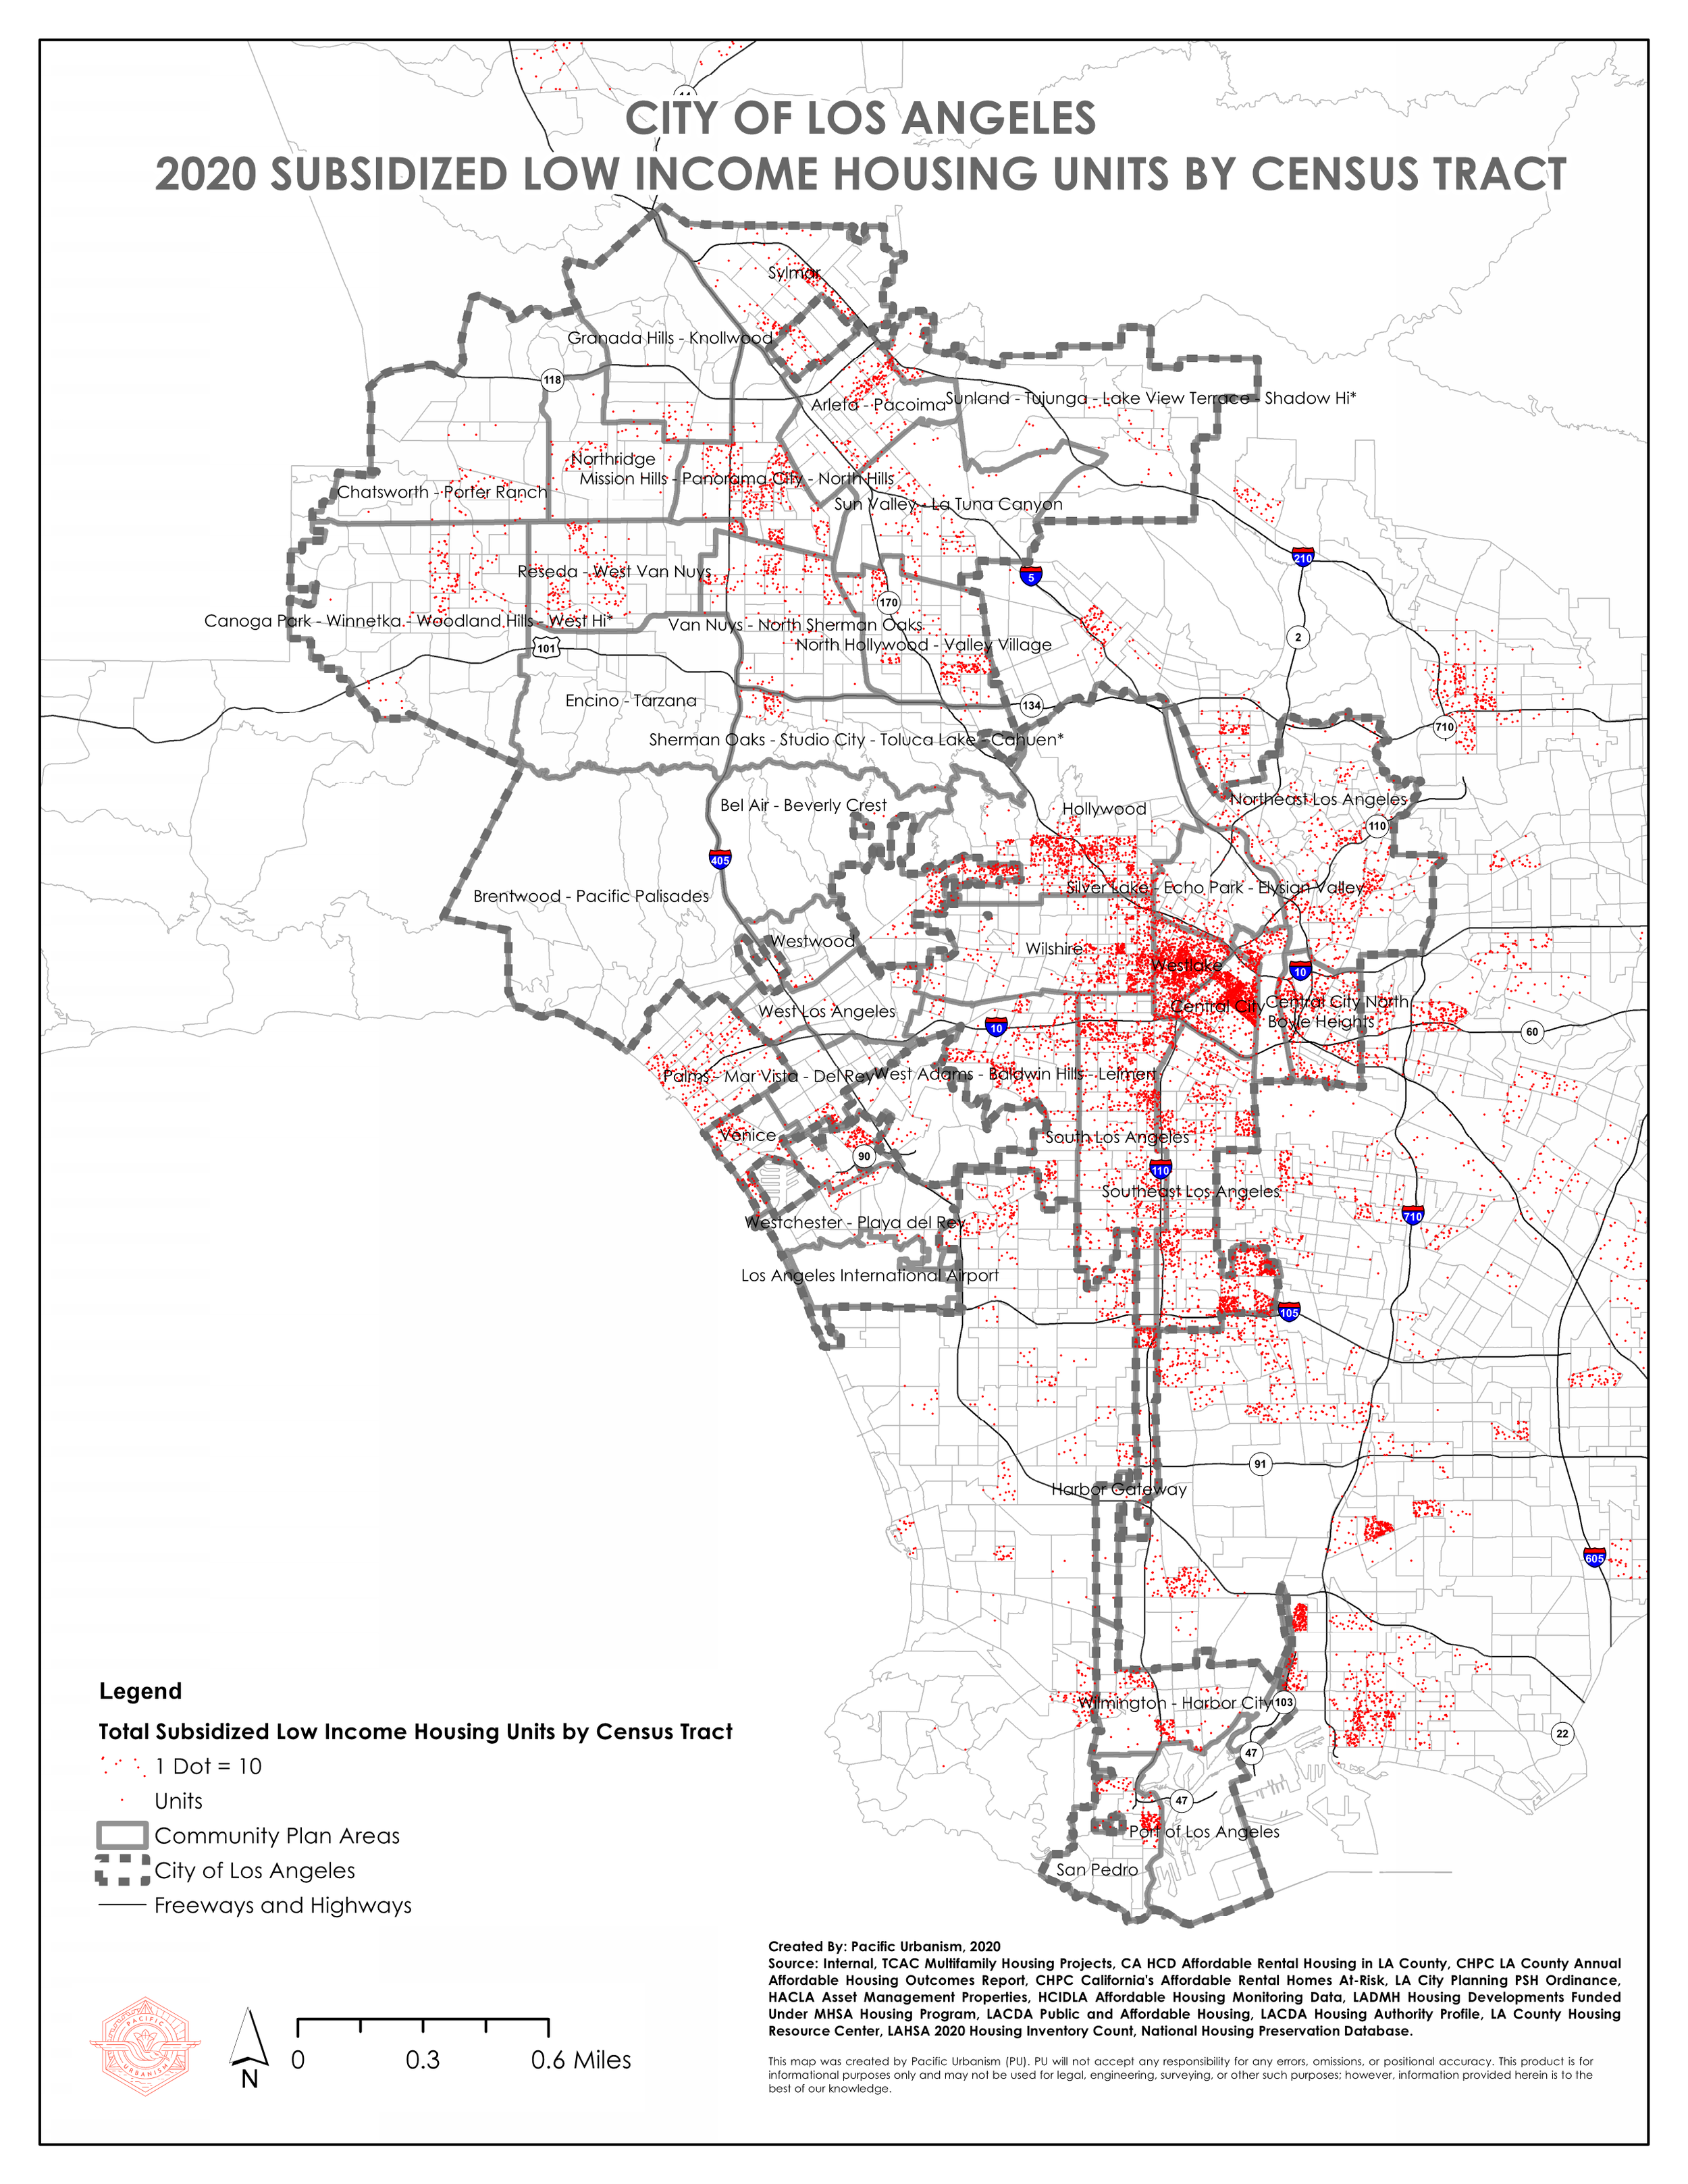
As of 2020, there are a total of 146,473 subsidized low income units spread out around 2,870 addresses, funded or managed by one to several of 15 entities or programs. LAHSA counts 46,723 beds or services under one or several of six types, including Permanent Supportive Housing. There are geographic and other disparities in the preponderance of affordable units by area.
In his 2013 dissertation, Dr. Greg Morrow conceptualized the City of Los Angeles as four quadrants: West and East Valley, West and East LA, which includes what was previously referred to as South Central. A disproportionate amount of affordable housing is located in the Eastside and East Valley quadrants of Los Angeles. In 2020, the Eastside quadrant represented the highest amount of subsidized low income housing in the city, with 71,000 units or 77% of the total. By contrast, the Westside’s share of affordable housing units, approximately 4,100 units, is 5% that of the Eastside quadrant. The West Valley quadrant fared similarly to the Westside, containing only a few hundred more affordable units, approximately 4,700. As will be noted below, there are disparities among Community Plan Areas (CPA) within quadrants. For example, Venice as a whole contains 3.3 units per 100 persons, on par with the 3.5 units per 100 overall on the Eastside.
Results by City of Los Angeles Council District (CD 1-15)
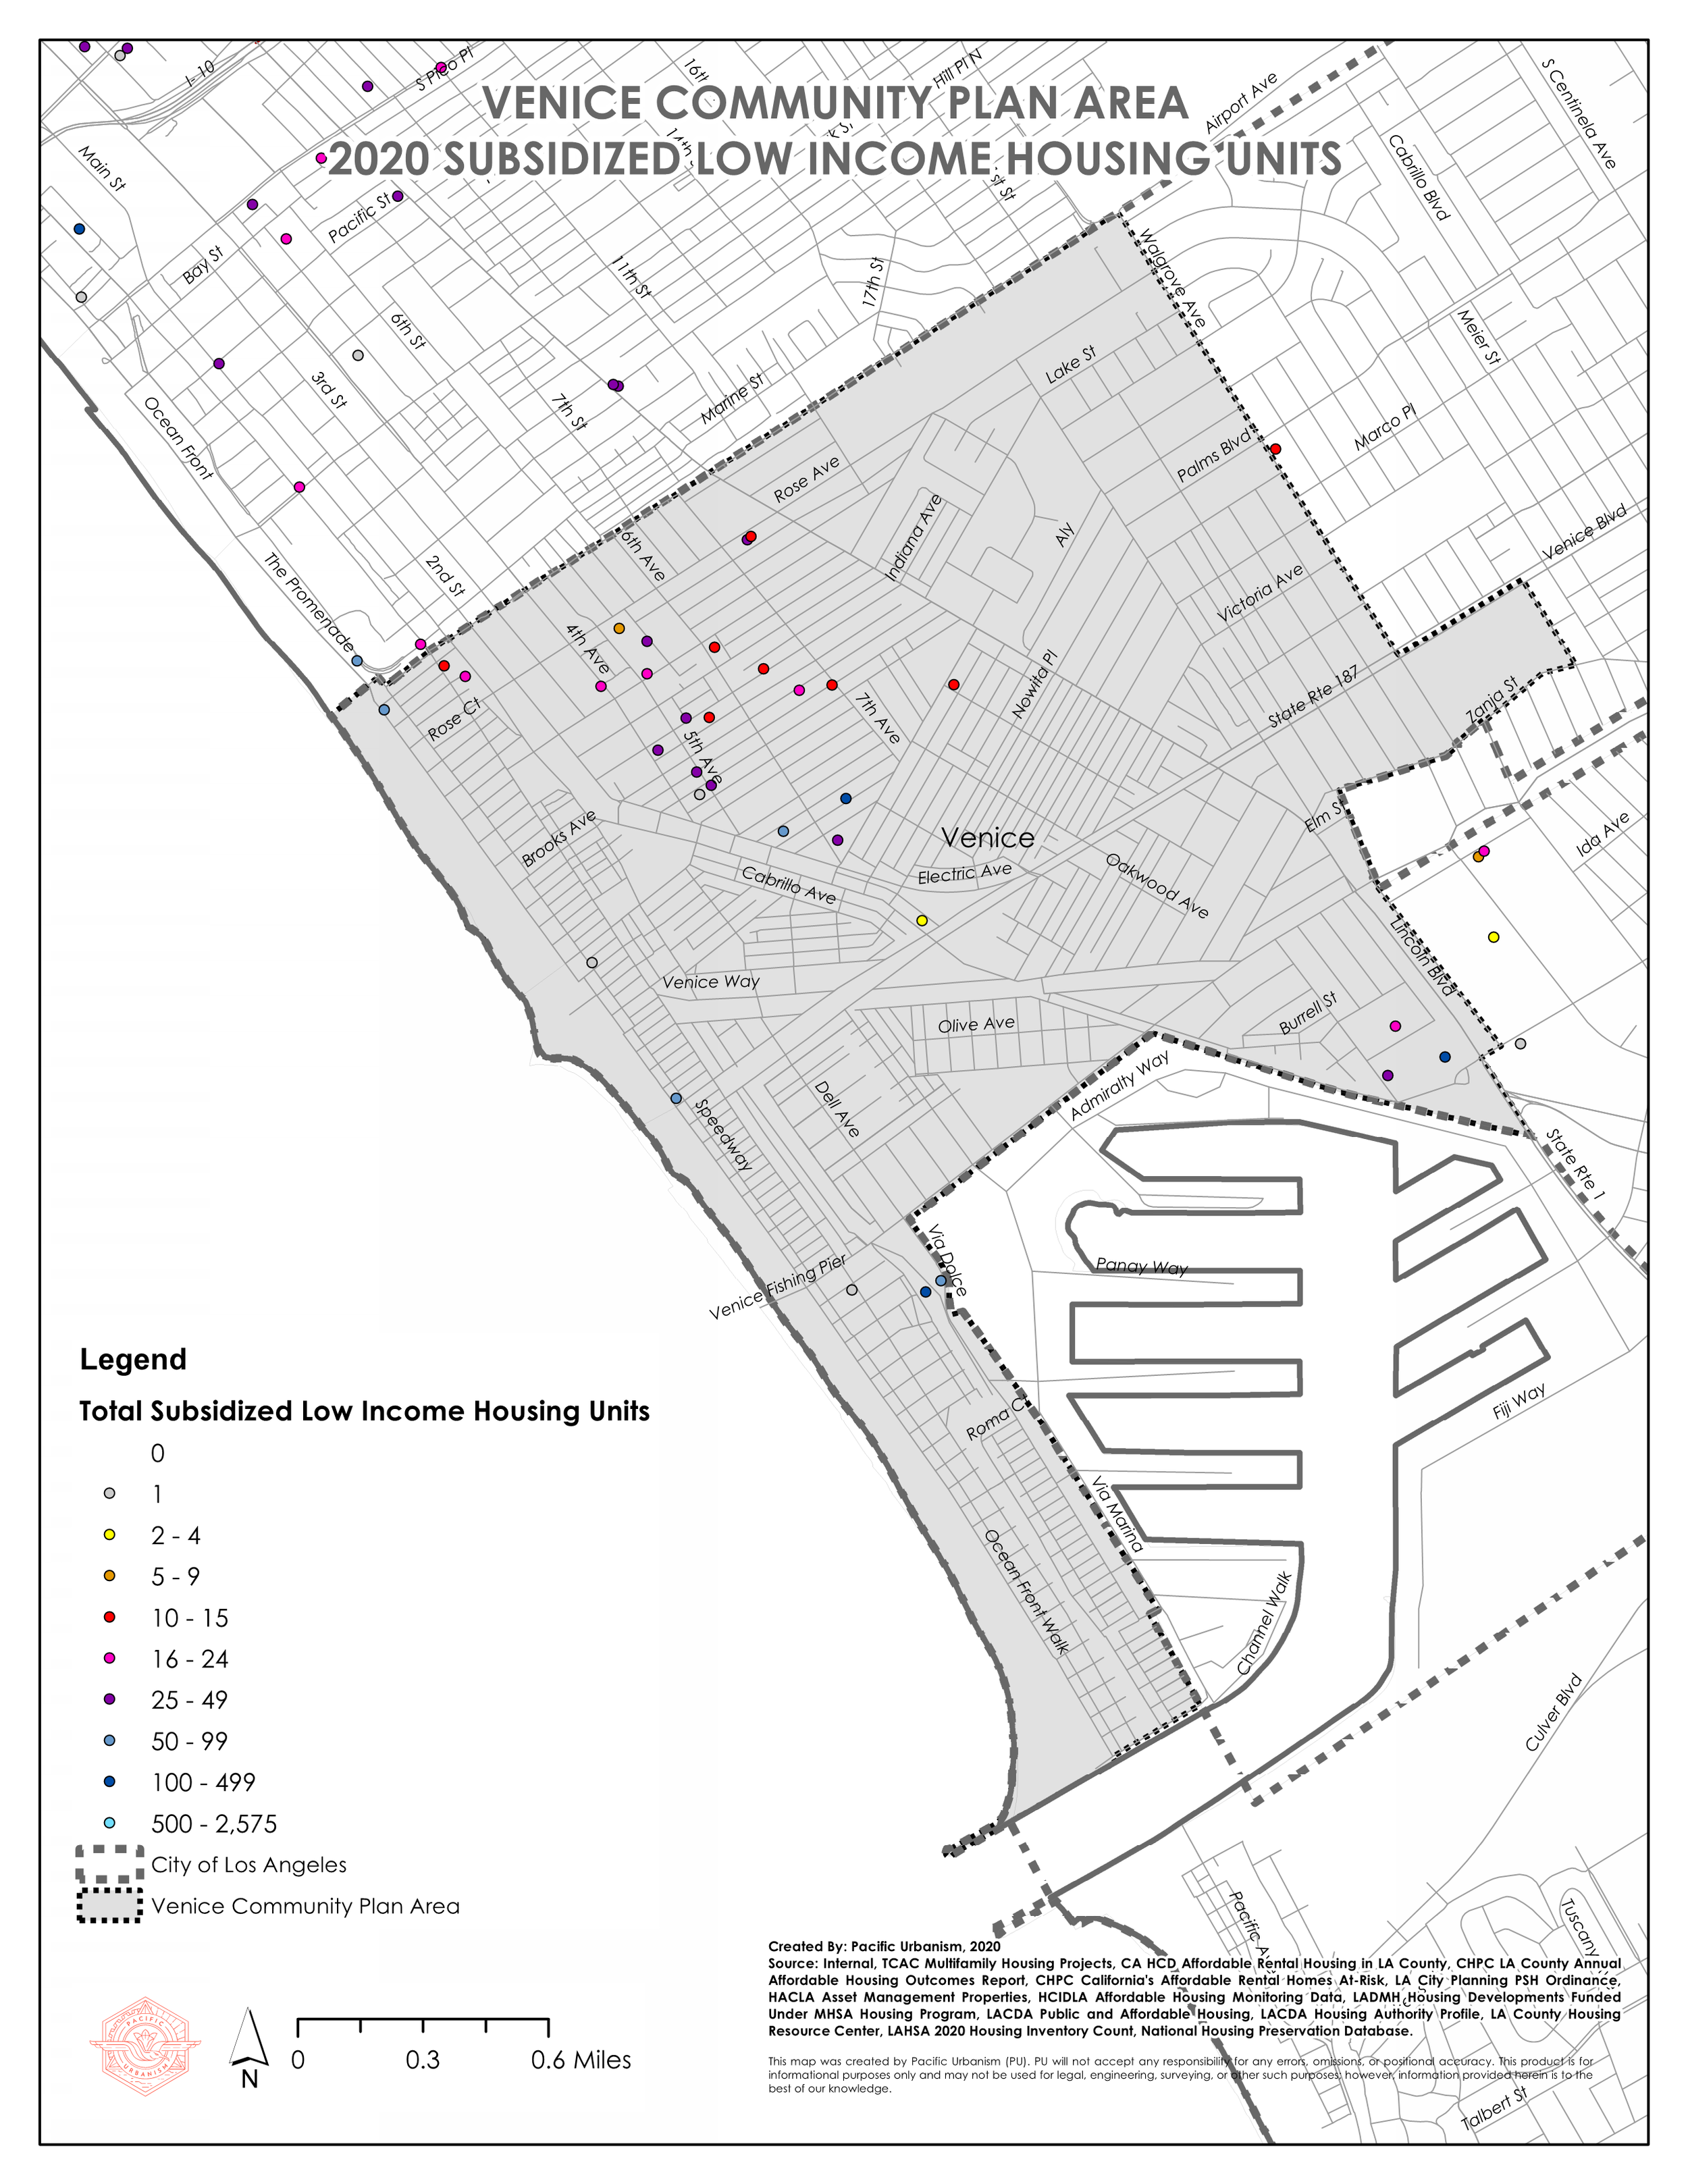
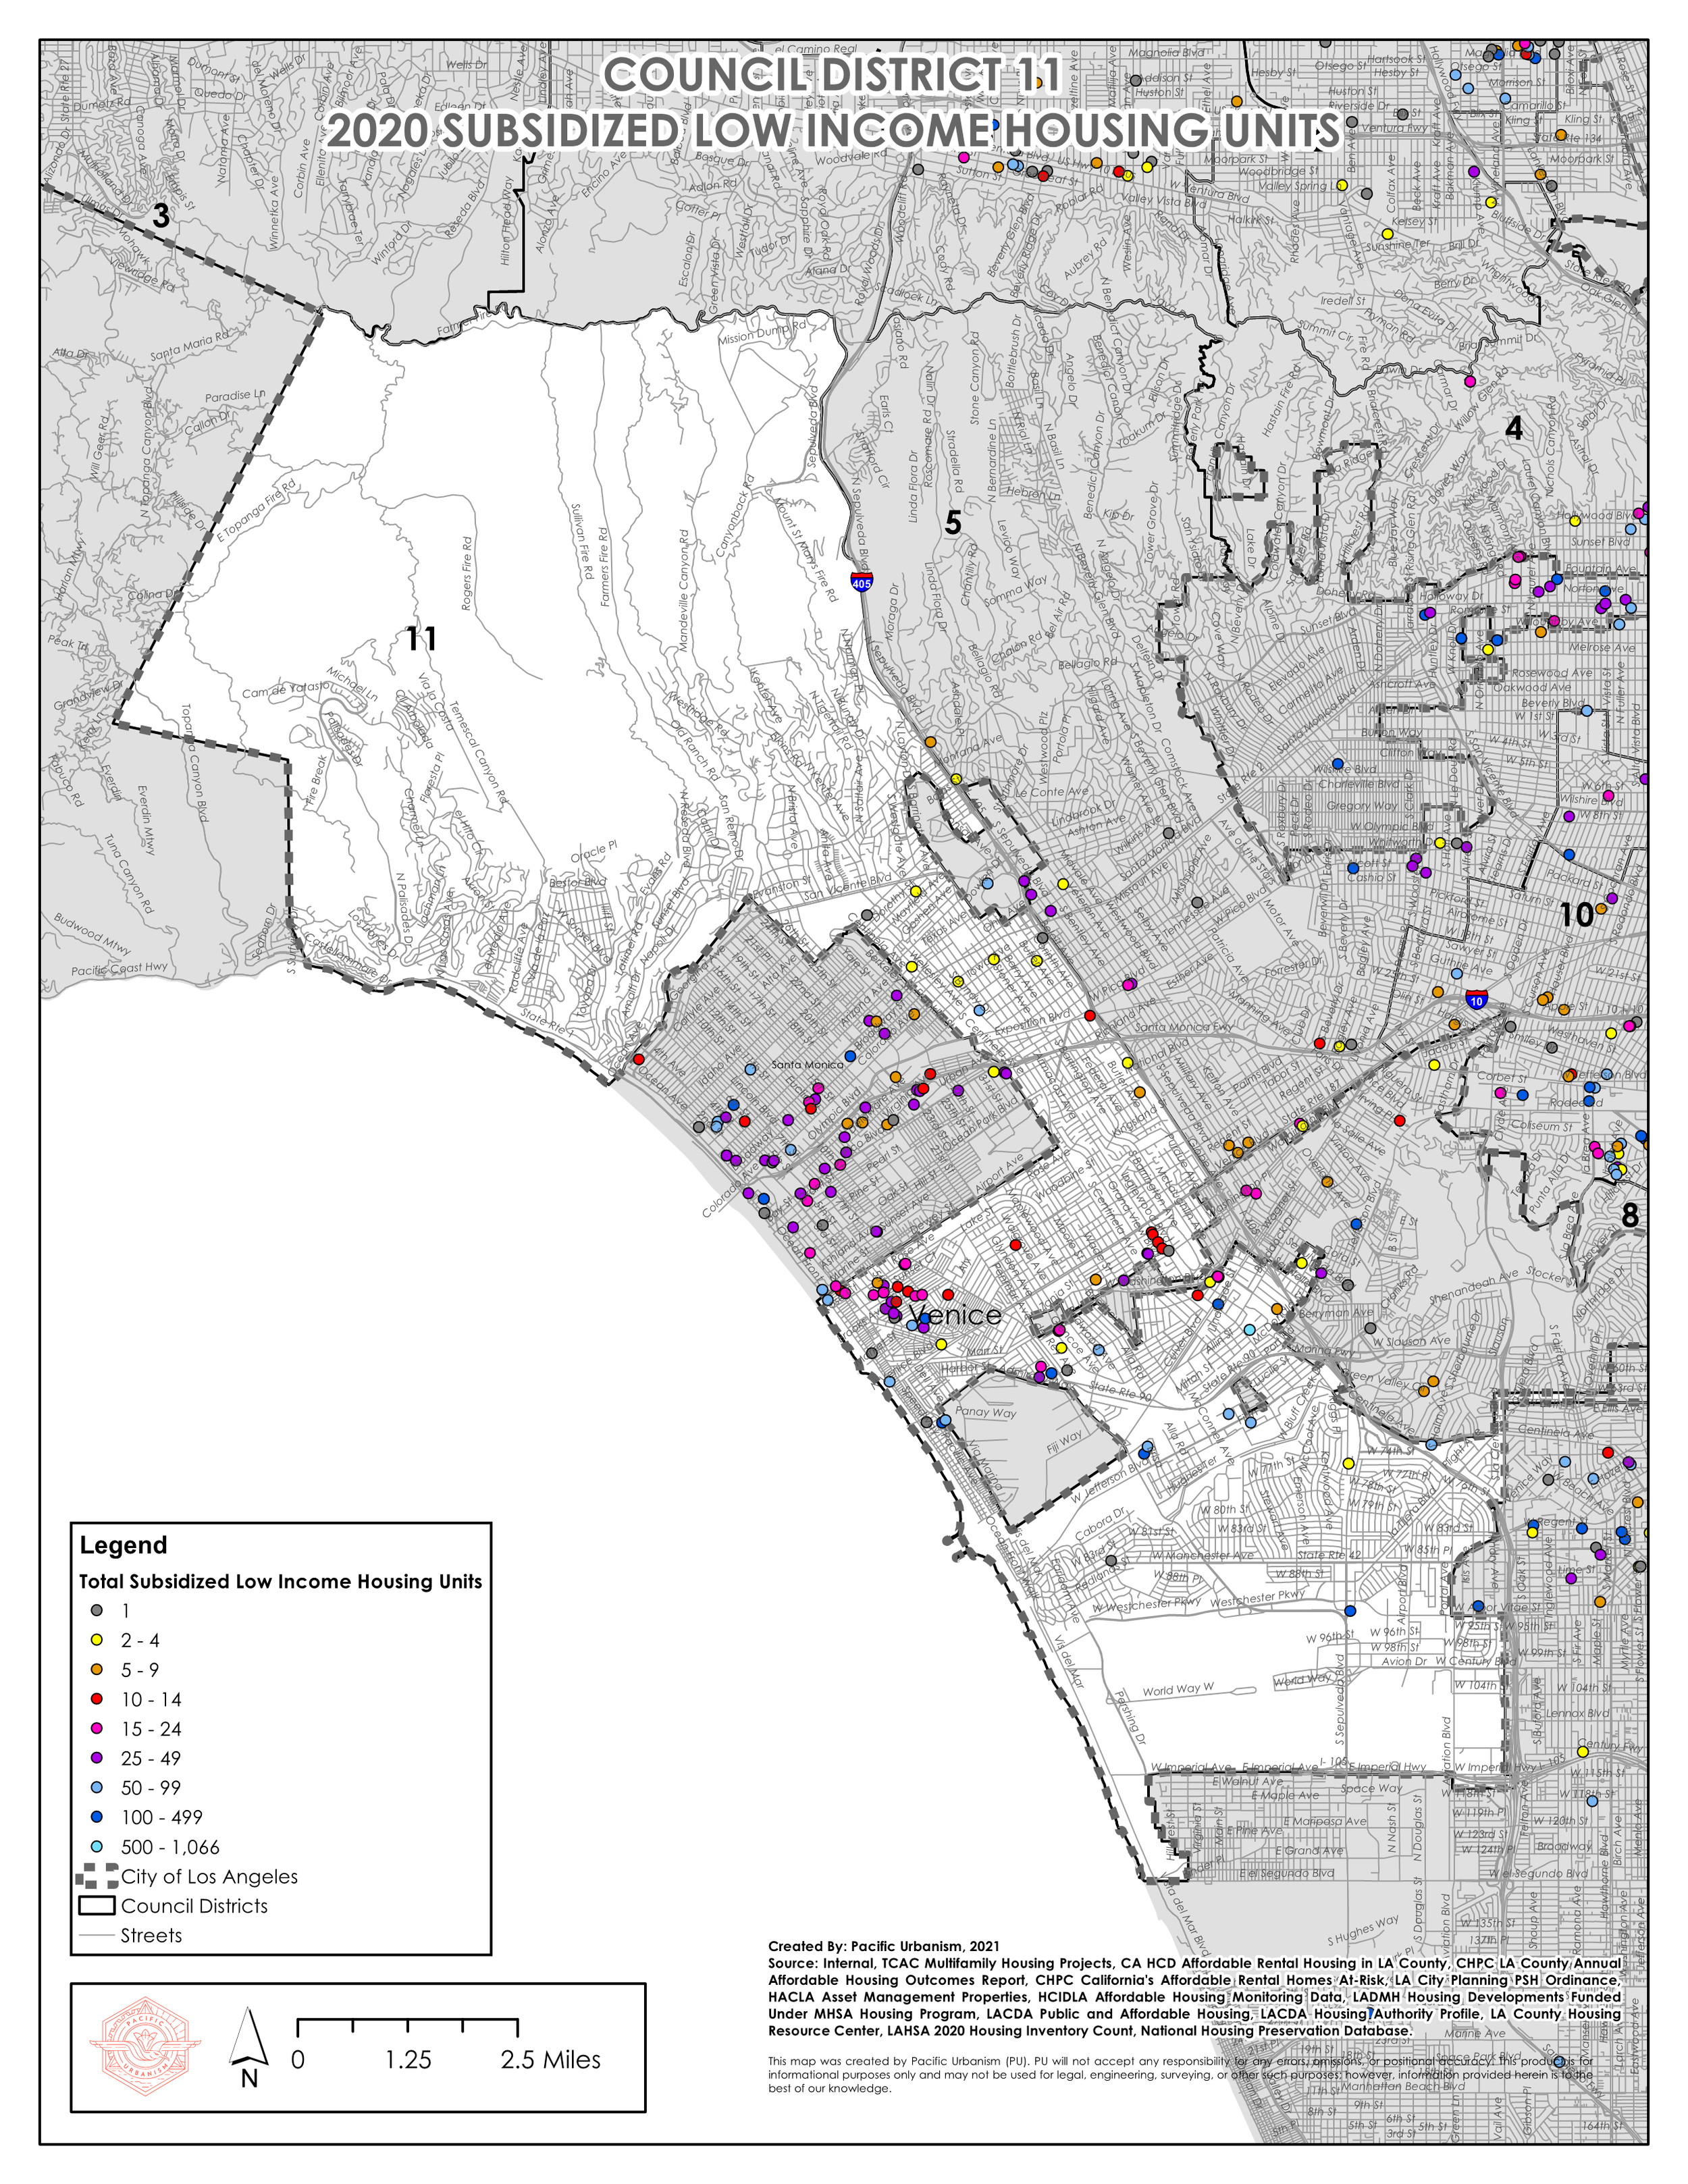
Results per Los Angeles City Council District show that the 14th District, represented by Councilperson De Leon, contains the majority of affordable housing units with 16,342. District 14 includes Skid Row and is home to some of Los Angeles’s most vulnerable populations. Compare this to District 5, represented by Councilperson Koretz, which contains just 608 of the share of affordable units. In stark contrast to District 14, District 5 is home to Bel Air and some of the most affluent neighborhoods in Los Angeles. Additionally, in Council District 11, which has a per capita rate of 1.2 affordable units per 100 people, Venice bears a disproportionate share with 3.3 units per 100 people.
Results by Community Plan Area (CPA) Results
In order to normalize results across LA’s 35 Community Plan Areas (CPAs), which vary in size and population, this study reports total units per 100 residents. The five CPAs with the highest rate of affordable units per 100 people are adjacent to one another in the Eastside quadrant. They are: Central City (23.7 units per 100 people), Westlake (9.2), Central City North (7.0), Boyle Heights (4.1), and Southeast Los Angeles (3.4). Interestingly, Venice, ranked 7th out of 35, has affordable housing units that are disproportionately clustered in the Oakwood neighborhood, where 553 units in a population of 6,503 results in rate of 8.5 affordable units per 100 persons, which is greater than the overall score of Hollywood, Southeast LA, Boyle Heights, Central City North, and just under Westlake (MacArthur Park).
Comparatively, the five CPAs with the lowest share of affordable units in the City are all part of the Westside quadrant: West Los Angeles, Bel Air - Beverly Crest, Westwood, Encino - Tarzana, and Brentwood - Pacific Palisades.
Conclusions
A more equitable distribution of affordable housing is desirable in the City of Los Angeles and the broader region. The affordable housing shortage is caused by the same forces at play in the overall housing shortage. Where some communities bear an unfair share of the housing burden, concentrations of poverty and unequal access to resources result. Fiscal resources are not sufficient to develop the needed affordable housing. For example, the City of LA would have to increase its annual budget threefold and then dedicate that in its entirety to affordable housing development in order to build the number of units necessary at the City’s cost of unit delivery. Conversely, modest policy reforms that affirmatively further fair housing and alleviate the need for subsidized low income housing, such as restoring development rights to land across the City in order for Naturally Occurring Affordable Housing to be produced, may provide immediate and lasting benefits to communities across the City and region.
Full bibliography and list of data sources can be found on the last pages of the appendix:


